User satisfaction in former patients in child and adolescent psychiatry
The adolescents who were most satisfied with the services provided by a CAP unit had better health, better finances, a higher level of education and a lower education drop-out rate, as adults.
Background: Few systematic studies have examined user satisfaction with services offered by Child and Adolescent Psychiatry units (CAP). At the Norwegian Institute of Public Health (NIPH), many studies can be found that deal with somatic healthcare services and quite a number that focus on mental health services for adults; however, there are very few that deal with CAP units. The user perspective is also lacking, as it tends to be the parents of users who are asked to participate.
Objective: The objective of the study is to increase knowledge about user satisfaction with CAP. We also wanted to find out if there is an association between user satisfaction with CAP units and self-reported health, finances, level of education, drop-out rate in education and/or unfitness for work in young adulthood.
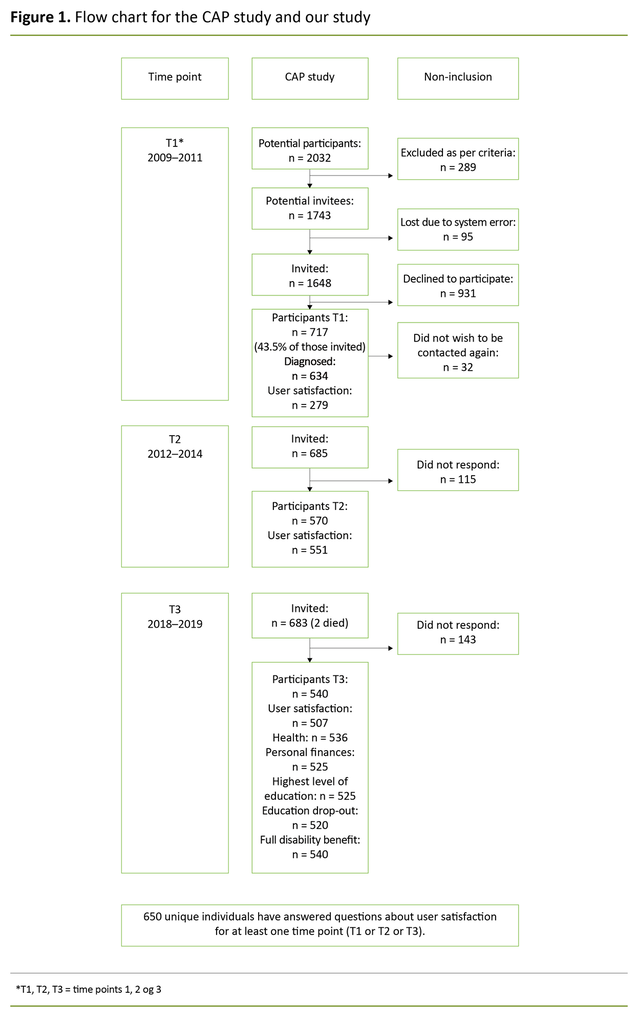
Method: The data for the study were collected from the health survey at St Olav's University Hospital, CAP unit (the CAP study), which is a longitudinal cohort study with three time points. At the first time point, 717 adolescents between 13–18 years of age participated in the survey; of these, 650 unique individuals responded to the question regarding user satisfaction at one or more time points.
Results: User satisfaction decreases over time, and patients with affective disorders had the greatest reduction in satisfaction. Adolescents who reported high user satisfaction also reported having better health, better finances, a higher level of education and a lower drop-out rate in commenced studies. The probability of being a full disability benefits recipient in young adulthood is, however, not related to satisfaction levels with the service provided by a CAP unit.
Conclusion: Adolescents who were dissatisfied with the service they received at a CAP clinic struggle in many areas of life as young adults. This can have lasting consequences in regard to participation in the labour market and the community, and may contribute to increased exclusion and segregation in society. More knowledge is needed about how we can help this group of adolescents. A good start would be to implement systematic measurements of user satisfaction with CAP units, as the Grøvli Committee suggested more than ten years ago.
The focus on user experience and satisfaction with the health service is increasing. At clinics (1), in research (2) and in education (3), user experience is a key aspect of the work. User experience can also be used as one of several measures of service quality, and it overlaps to a certain extent with treatment outcomes (4, 5).
Increased user involvement and satisfaction is one of several goals in the government white paper, National Health and Hospital Plan for 2020–2023 (Meld. St. 7 (2019–2020)) (6). In addition, interaction with and involvement of young service users and their families is emphasised in the new patient pathway for mental health and substance abuse (7).
User involvement in the development of individual treatment plans is also one of the indicators that are to be measured in the patient pathway for mental health and substance abuse (8). One systematic review showed that feedback-informed services have a positive impact on treatment-related outcomes (9).
However, user experience and satisfaction with CAP units has not been explored to any great extent in research or user satisfaction surveys such as PasOpp.
In 2005, SINTEF Department of Health Research found that parents with younger children had a higher level of satisfaction than parents with older children. Long treatment episodes had a positive impact on satisfaction, while long waiting lists had a negative impact. Children and adolescents were less satisfied than their parents with therapists, and younger children tended to be more satisfied than older children (10).
In general, a large proportion of the service users were somewhat dissatisfied with opportunities for involvement. There was a positive correlation between parents’ and children’s reported satisfaction with CAP units. Findings were based on three sub-studies, including a survey of user satisfaction among 2 253 parents and 1 236 adolescents (10).
Bjørngaard et al. (2007) examined the association between mental disorders and user satisfaction in adults. They found that both a reduction in symptoms and an improvement in the level of functioning increased user satisfaction (11).
A qualitative study carried out by Bjønnes in 2020 indicated that adolescent CAP service users wanted to be more actively involved in treatment, but that this requires more individually tailored treatment and changes to the treatment culture. The study was based on three focus-group interviews with 15 health personnel employed in in-patient care at CAP units in Norway (12).
The Competence Center for Lived Experience and Service Development has developed and tested a method entitled ‘My voice counts’ in CAP. In their final report, they emphasise the need for adolescents to be taken seriously, to be heard and also to receive practical advice about how to deal with their problems (13).
SINTEF’s final evaluation report on the patient pathway for mental health and substance abuse states that, ‘Many patients do not have any meaningful influence on their own treatment plan or receive information about the patient pathway.’ Further, they say that services have a long way to go before the objectives in the patient pathways for mental health and substance abuse are fulfilled (14).
The objective of the study
User satisfaction is measured regularly in health services in Norway today. This applies in particular to specialist health services (15). We see that the majority of such studies are conducted in somatic healthcare services. Slightly fewer studies are conducted in mental health services for adults, while CAP units are the focus of very few studies. In CAP, as in other services for children and adolescents, it is often the parents who are asked about their experiences with the service rather than the children and adolescent service users themselves (16).
The studies are predominantly cross-sectional studies, in which user satisfaction is measured at one time point in the service. Whether or not user satisfaction is stable over time has not been previously measured among young CAP service users.
In this study, we wanted to examine the following issues:
- Does user satisfaction among adolescents in CAP units change over time, and does this differ between patients in different diagnostic categories?
- Is there an association between user satisfaction with CAP units and the self-perceived level of health, finances, level of education, drop-out rate in education and/or unfitness for work among young adults?
Method
The data used in this study came from the health survey conducted at St Olav's University Hospital, CAP unit (the CAP study), which is a longitudinal cohort study including 717 adolescents. The CAP study included all in-patients and out-patients at the CAP unit, St Olav’s University Hospital between 2009–2011, and they were all invited to participate in follow-up studies three and nine years later.
At the first time point (T1), the median age of participants was 15.6 years and 55% of the sample were girls. In the CAP study, 650 unique individuals responded to questions regarding user satisfaction at one point or at several points in time. Figure 1 provides a more detailed presentation of the sample in the CAP study and in our study.
Instruments
For the variable of user satisfaction, different questions were posed at the three time points, but all of them were based on a 5-point Likert scale. At T1, adolescent participants were asked if ‘the clinic’s service helped me’. The question posed at T1 was devised in connection with the CAP project and has not been used in other studies.
At T2, adolescent participants were asked: ‘What do you think of the help you received from CAP?’ At T3, they were asked: ‘Overall, how satisfied are you with the treatment you received from CAP?’ At T2 and T3 in the CAP study, the questions were adapted to the user satisfaction question used in the PasOpp surveys (17).
At T1, all of the participants were CAP service users; at T2, some of the participants were CAP service users, while others had been discharged – either because they had completed their treatment or because of their age. At T3, none of the participants were CAP service users. Therefore, at T2, some of the participants responded retrospectively to the question about user satisfaction and at T3, all of the participants did so.
The diagnosis at T1 was a principal psychiatric diagnosis, determined in accordance with the International Statistical Classification of Diseases and Related Health Problems, 10th revision (ICD-10) multi-axial diagnostics (axes I–VI).
In our study, the diagnoses at T1 were categorized as: ‘affective disorders’ (n = 149), ‘neurodevelopmental disorders’ (n = 249), ‘eating disorders, trauma, dissociative disorders and OCD’ (n = 101), ‘other’ (n = 86) and ‘none’ (n = 49).
The young adult participants were asked the following questions: ‘How is your health now?’ based on a 4-point Likert scale; ‘How would you describe your finances?’ based on a 5-point Likert scale; and ‘What is your highest completed education? with six possible response alternatives.
They were also asked if they had dropped out of education despite wanting to complete it, with a ‘yes/no’ answer. In addition, they were asked if they received benefits from the Norwegian Labour and Welfare Administration (NAV), with a ‘yes/no’ answer. If they answered ‘yes’, they were asked to specify which benefits they received, with full disability benefits being one option.
These variables were also used in several waves of the Trøndelag Health Study (The HUNT Study), except for dropping out of school and welfare benefits from NAV.
Analyses
To study changes over time, we used a linear mixed-effects model with user satisfaction as a dependent variable, time as a categorical independent variable and participant as a random effect. The association in user satisfaction between the time points was analysed using the Pearson correlation coefficient.
To examine the associations at T3, we used linear regression with self-reported health, finances and level of education, one at a time, as dependent variables, and user satisfaction as independent variable. The normal distribution of residuals was confirmed by the visual inspection of Q-Q plots.
We used logistic regression with the drop-out rate in education and the receipt of full disability benefits, one at a time, as dependent variables, and user satisfaction as independent variable.
Since we tested several hypotheses, we used a significance level of 1% to reduce the risk of false positive findings. All analyses were adjusted for age and gender, which can be underlying factors, and were carried out using SPSS 25.
Ethics
For the CAP main project, the following Regional committees for medical and health research ethics (REK) decisions and references apply: T1: 4.2008.1393, T2: 2011/1435/REK Midt and T3: 2017/1486 REK Midt.
For our study, REK decision 2020; 89873 applies.
Results
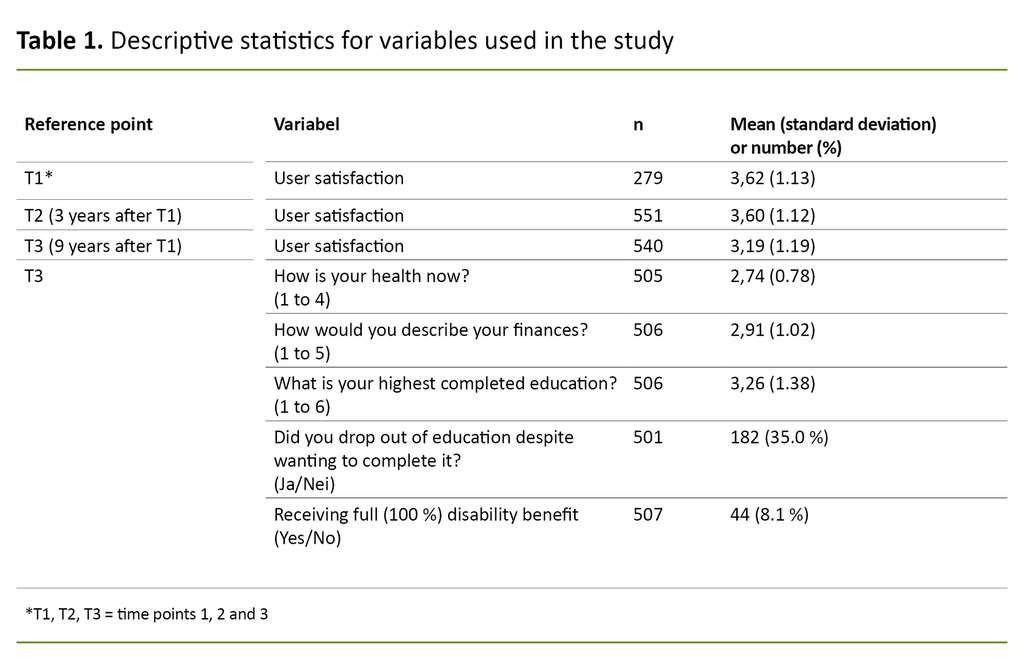
User satisfaction changed very little from T1 to T2. At T3, user satisfaction was reduced by 0.43 points (p < 0.001) compared to T1, and by 0.41 points (p < 0.001) compared to T2 (Table 1).
The group of service users who were very dissatisfied or somewhat dissatisfied with treatment at CAP unit at T3 amounted to 27.0%, which was an increase from 14.4% at T1 and 14.7% at T2.
The correlation between user satisfaction at the three time points was 0.433 (n = 216), 0.329 (n = 206) and 0.530 (n = 440) between T1 and T2, between T1 and T3 and between T2 and T3 respectively.
User satisfaction changed over time
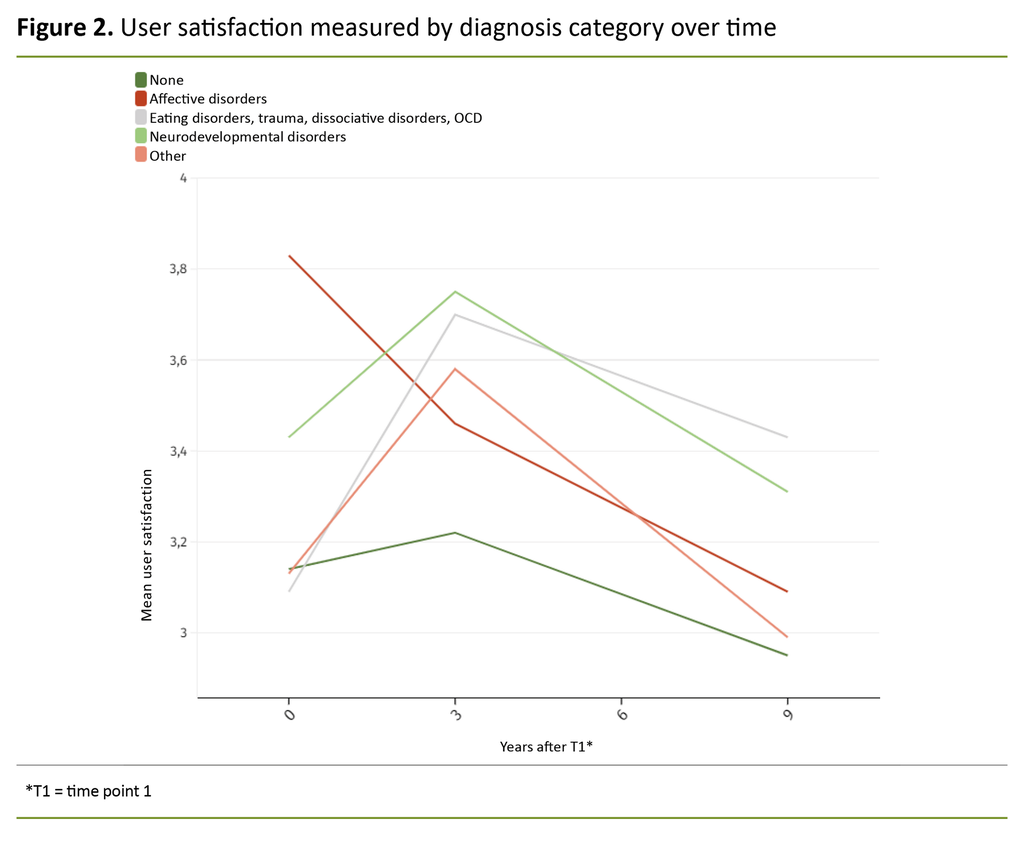
The analyses of the diagnostic categories confirmed that user satisfaction changed over time (Figure 2). We also saw that there were clear differences between the various categories. All of the categories showed a reduction in user satisfaction from T2 to T3, and the ‘affective disorders’ category had the greatest reduction from T1 to T3.
At T3, the diagnostic categories ‘neurodevelopmental disorders’ and ‘eating disorders, trauma, dissociative disorders and OCD’ had the highest levels of user satisfaction. The p-value for interaction between time and the diagnostic category was 0.043.
In our study, 40% of the women and 22% of the men reported having poor health, while 31% of the women and 28% of the men reported having poor finances.
In our study, 40% of the women and 22% of the men reported having poor health.
A total of 14% of the women and 9% of the men reported having only completed primary and lower secondary school. Furthermore, 17% of the women and 31% of the men had a trade or journeyman’s certificate, while 27% of the women and 14% of the men had a higher education. Of the women, 39% had dropped out of education despite wanting to complete it, as opposed to 31% of the men.
The more satisfied service users are with CAP unit, the better their health and finances
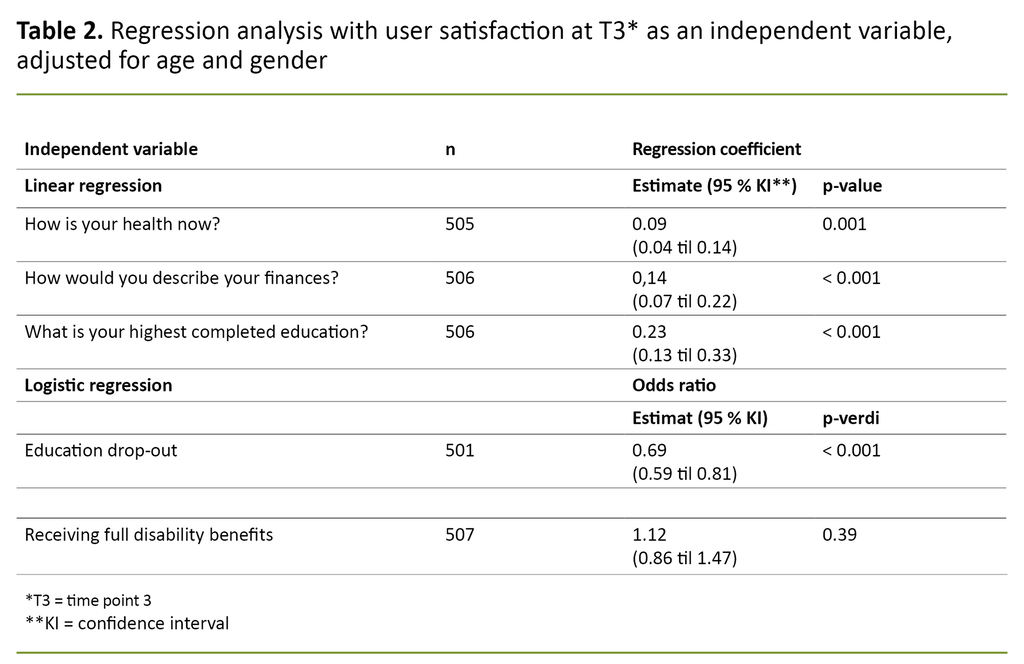
The study showed a clear association between user satisfaction and self-reported health, finances, level of education and drop-out rate in education (Table 2). The more satisfied that service users were with the help they received at CAP unit, the better their self-reported health, finances and level of education as adults, and there was less chance that they had dropped out of commenced studies.
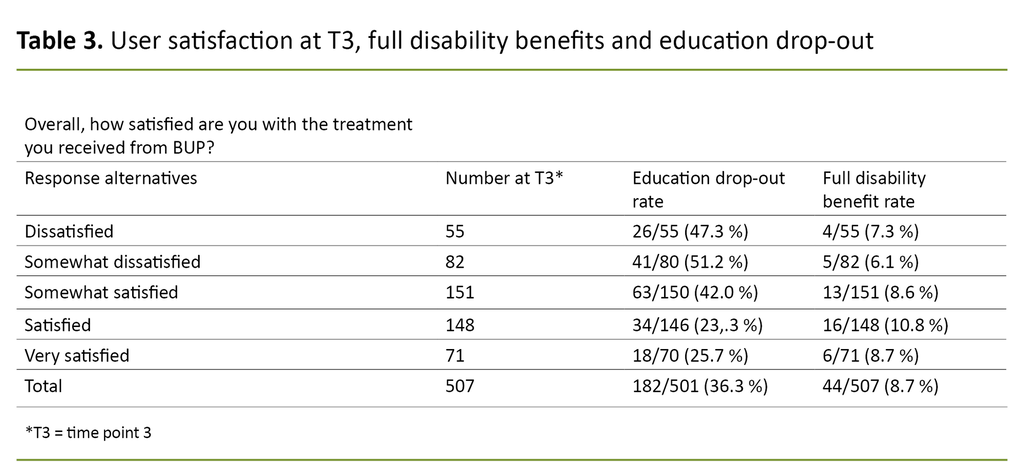
Of those who reported the highest level of user satisfaction, 26% had dropped out of commenced studies, whilst of those who reported the lowest level of user satisfaction, 47% had dropped out of education despite wanting to complete it (Table 3).
The regression coefficient for self-reported health in Table 2 is 0.09. This means that those with the highest level of user satisfaction score, on average, 0.09 x 4 = 0.36 higher on self-reported health than those with the lowest level of user satisfaction, as the distance between the lowest and highest level of user satisfaction consists of four levels.
Similarly, the effects for finances and highest level of education equal 0.14 x 4 = 0.56 and 0.23 x 4 = 0.92. The odds ratio for education drop-out, when these are compared with the lowest and highest levels of user satisfaction, is 0.694 = 0.23. These effects must be said to be clinically significant.
We did not identify any association between user satisfaction and receipt of full disability benefits (p = 0.39). In our sample, 44 participants were receiving full disability benefits, N = 507. These were distributed evenly across the satisfaction scale (Table 3).
Although we can see clear associations between user satisfaction and several of the dependent variables, this does not imply anything about cause and effect.
Discussion
In a nine-year perspective, there was a decline in user satisfaction among adolescents in CAP unit, and patients with affective disorders experienced the greatest decrease. Those with the highest satisfaction levels at T1 were also satisfied at T2 and T3.
We also identified an association between user satisfaction and self-reported health, finances or level of education, and between user satisfaction and education drop-out. In contrast, there was no association between user satisfaction and receipt of full disability benefits.
User satisfaction in CAP
Most adults were satisfied with the services they received at CAP unit. Adults who are former patients in CAP units, however, were less satisfied nine years after using the service compared to when they started using the service and immediately after they had used the service. Possibly, young people are reluctant about giving a negative response when they are in treatment in case it has implications for them and their treatment (19).
The lower satisfaction levels in former CAP service users after nine years could also be because they have developed greater insight into their mental health and how it affects their life. More than one in four of those who had been CAP service users in the period 2009–2011 were not satisfied, as adults, with the help they had received when they were young.
The corresponding figures from Norwegian hospitals are 3% (20) for somatic admissions (in-patients) and 8% for adult psychiatry admissions (in-patients) (21).
Ranøyen et al. found in their study using the same data that adolescents at T1 with anxiety and/or depression tended to have the same disorders or comorbid affective disorders three years later (22).
Adults who are former CAP service users were less satisfied nine years after using the service.
Earlier research has shown that chronic disorders affect life satisfaction and may affect user satisfaction retrospectively (23). Persistent problems with anxiety and/or depressive thoughts can lead to young people losing faith in the treatment, which in turn reduces user satisfaction.
Gårdvik et al. also found in the same data that three out of four young people still had a mental disorder after three years, and that the degree of comorbidity had increased (24).
A large proportion of CAP service users have ADHD, and ADHD in childhood is also associated with chronic health problems in adulthood (25). These factors may partly explain the somewhat lower user satisfaction with CAP units compared with somatic health care and adult psychiatry.
User satisfaction and self-reported health
It is alarming that over a third of the women and almost a quarter of the men in our data material reported having poor health. This is more than double the figures in the most recent population survey in Nord-Trøndelag – HUNT4 (18).
The findings in our study confirm earlier findings which show that many young people who struggle with their mental health continue to do so in adulthood (26). Perhaps it can also explain why the World Health Organization (WHO) and the Norwegian government are worried about the effect that mental disorders have on the individual, their families and society (27, 28).
Some mental disorders are, like some somatic disorders, more long-term and have a major impact on the individual’s ability to care for themselves and others. Health can affect a person’s level of functioning, ability to work and ability to interact with other people (22).
User satisfaction and self-reported finances
Earlier research suggests that poor finances and poverty affect people’s lives physically and mentally (29, 30), and in our study we saw a clear association between user satisfaction and self-reported finances.
In our study we saw a clear association between user satisfaction and self-reported finances.
Mental health affects a person’s ability to work, which in turn affects personal finances. If a person cannot afford to pay the next month’s rent or electricity bill they may worry about the consequences and experience frustration and stress, which in turn can impact on both their physical and mental health.
In the report from the Living Conditions Survey EU-SILC 2017, Statistics Norway identifies an association between finances and health and shows that satisfaction with life in general increases in line with income (30). This may also partly explain our findings.
User satisfaction and education
We also saw an association between the patients who were satisfied with the help they received in CAP unit and the highest level of education, in addition to drop-out from commenced studies. We know that job prospects are more limited for those who drop out of education or who do not have a vocational or professional qualification. This in turn can lead to poorer finances, which in turn can impact on health (31).
We also know that it is increasingly difficult to get a job in Norway without a formal vocational qualification, and that the jobs that are available for those without a formal qualification are often in less regulated industries with poorer wages and working conditions.
Education is therefore often viewed as the key to future job security. This needs not be higher education – a vocational trade certificate can often lead to good job prospects.
Health, finances, level of education and education drop-out are all closely linked, and the study shows that there is an association between user satisfaction in CAP unit and these four factors. We know that poor mental health is one of the main reasons for dropping out of upper secondary school.
Dropping out reduces the possibility of obtaining a trade certificate or a higher education, which in turn affects the opportunities for job security and a decent wage – which also impacts on future mental and physical health. These factors may partly explain the fall in user satisfaction from T1 to T3.
User satisfaction and receipt of full disability benefits
No association was found between user satisfaction and receipt of full disability benefits. However, 8.1% of the adults in our study reported being unfit for work. In the general population, the proportion is 1.8% for the age group 18–24 years and 3.5% for those aged 25–34 years, according to Statistics Norway (32).
No association was found between user satisfaction and receipt of full disability benefits.
These figures are as expected, as our respondents were from a clinical sample, but they also confirm statistics dating back a number of years which show that mental health is one of the main causes of unfitness for work among young people.
Possible implications of the study
More research on this topic is recommended. In particular, it would be interesting to have a deeper understanding of why the young adults were satisfied or dissatisfied. A qualitative study could identify subjectively relevant factors that affect the satisfaction of adolescent CAP service users.
Our study suggests that standard measurements of user satisfaction, which were proposed over ten years ago by the now defunct Grøvli Committee (33), can provide relevant data for the clinical work in CAP units. Perhaps such measurements could identify the young people who subsequently struggle with their health, have poor finances or a low level of education, or who drop out of school.
Identifying these young people and establishing good cross-agency teams (34) to provide more help in the transition from adolescent to young adult could perhaps improve self-perceived health, finances, level of education and reduce education drop-out (30).
Early identification and help for patients who experience low user satisfaction can make a major difference for the individuals concerned, and the economy would benefit if fewer people needed help from the state.
Strengths and weaknesses of the study
The main weakness of our study was the use of different questions to measure user satisfaction at the three time points. Another limitation was that the study does not distinguish between different patient pathways and/or treatment options.
A strength of our study is that the CAP study at the last two time points was based on questions about user satisfaction in the PasOpp surveys. In addition, there were a large number of participants in at least one of the time points, and the response rate was high at T2 and T3.
Conclusion
Retrospectively, user satisfaction dropped significantly nine years after participants had been CAP service users at St Olav’s University Hospital. Those with the highest satisfaction levels at T1 were also satisfied at T2 and T3. Adolescents with affective disorders had the largest drop in user satisfaction from T1 to T3.
Many of the adolescents who had used CAP services are still facing major problems. Particularly those who were not satisfied with the help they received from CAP unit struggle in several aspects of their life. They have poorer health and finances and a lower level of education than others, and the education drop-out rate is higher in this group.
These factors have a mutually reinforcing effect. We know that education level and finances are closely linked, and that socioeconomic factors can be passed down the generations. It is therefore crucial that these young people are identified while there is still time, but this requires active efforts from all the agencies involved.
We recommend that CAP units implements the Grøvli Committee’s proposal for regular use of feedback tools, and that the young people with a low score on user satisfaction are closely followed up by the specialist health service and primary health service.
References
1. Helsedirektoratet. Veileder for poliklinikker i psykisk helsevern for barn og unge. Oslo: Helsedirektoratet; 2018. IS-1570. Available at: https://www.helsedirektoratet.no/veiledere/psykisk-helsevern-for-barn-og-unge-veileder-for-poliklinikker/Veileder%20for%20poliklinikker%20i%20psykisk%20helsevern%20for%20barn%20og%20unge.pdf/_/attachment/inline/829f53aa-0b66-4139-8add-944c95d5b163:b03ce59e25e43dc7623f1b5940aff644ae83eb6a/Veileder%20for%20poliklinikker%20i%20psykisk%20helsevern%20for%20barn%20og%20unge.pdf (downloaded 13.12.2021).
2. Weldring T, Smith SM. Patient-Reported Outcomes (PROs) and Patient-Reported Outcome Measures (PROMs). Health Services Insights. 2013;6:61–8. DOI: 10.4137/HSI.S11093
3. Hansen J, Lyngvær EK, Grønning K. Gode erfaringer med brukermedvirkning. Sykepleien; 2016;104(11):44–5. DOI: 10.4220/Sykepleiens.2016.59391
4. Bjørngaard JH, Andersson HW, Ose SO, Hanssen-Bauer K. User satisfaction with child and adolescent mental health services. Social Psychiatry Psychiatric Epidemiology. 2008;8:635–41. DOI: 10.1007/s00127-008-0347-8
5. Meld. St. 10 (2012–2013). God kvalitet – trygge tjenester. Kvalitet og pasientsikkerhet i helse- og omsorgstjenesten. Oslo: Helse- og omsorgsdepartementet; 2013.
6. Meld. St. 7 (2019–2020). Nasjonal helse- og sykehusplan 2020–2023. Oslo: Helse- og omsorgsdepartementet; 2019. Available at: https://www.regjeringen.no/contentassets/e353a5d022d84deabd969a5fe043783e/no/pdfs/i-1194_b_kortversjon_nasjonal_helse.pdf (downloaded 21.09.2021).
7. Helsenorge.no. Hva er pakkeforløp for psykisk helse og rus? Oslo: Direktoratet for E-helse; 2020. Available at: https://www.helsenorge.no/psykisk-helse/pakkeforlop-for-psykisk-helse-og-rus/hva-er-pakkeforlop-for-psykisk-helse-og-rus/ (downloaded 21.09.2021).
8. Helsedirektoratet. Pakkeforløp psykisk helse og rus. Beskrivelse av indikatorer for pakkeforløp for psykisk helse og rus. Oslo: Helsedirektoratet; 2020. Available at: https://www.helsedirektoratet.no/pakkeforlop/dokumenter-pakkeforlop%20psykisk%20helse%20og%20rus/Pakkeforl%C3%B8p%20for%20psykisk%20helse%20og%20rus%20-%20beskrivelse%20av%20indikatorer.pdf/_/attachment/inline/db2e1a9e-7080-4ab1-bf3a-08385725ccaf:5e59774ccb871f688ff896dde587becaaf2dd5a4/Pakkeforl%C3%B8p%20for%20psykisk%20helse%20og%20rus_Beskrivelse%20av%20indikatorer.pdf (downloaded 21.09.2021).
9. Gondek D, Edbrooke-Childs J, Fink E, Deighton J, Wolpert M. Feedback from outcome measures and treatment effectiveness, treatment efficiency, and collaborative practice: a systematic review. Administration and Policy in Mental Health and Mental Health Services Research. 2016;43(3):325–43. DOI: 10.1007/s10488-015-0710-5
10. Anderson HW, Ose SO, Sitter M. Psykisk helsevern for barn og unge – Behandlernes og brukernes vurderinger av behandlingstilbudet. Trondheim: Sintef; 2005. Sintef Helse report STF78 A055009. Available at: https://www.sintef.no/globalassets/upload/helse/psykisk-helse/pdf-filer/stf78_a055009.pdf (downloaded : 13.12.2021).
11. Bjørngaard JH, Ruud T, Friis S. The impact of mental illness on patient satisfaction with the therapeutic relationship. Social Psychiatry Psychiatric Epidemiology. 2007;42:803–9. DOI: 10.1007/s00127-007-0229-5
12. Bjønnes S, Grønnestad T, Storm M. I’m not a diagnosis: adolsescents’ perspectives on user participation and shared decision-making in mental healthcare. Scandinavian Journal of Psychiatry and Psychology. 2020;8:139–48. DOI: 10.21307/sjcapp-2020-014
13. Høiseth JR. Sluttrapport: Min stemme teller. Rapport 2/2021. Trondheim: Stiftelsen Kompetansesenter for brukererfaring og tjenesteutvikling – KBT; 2021. Available at: https://kbtkompetanse.no/wp-content/uploads/2021/05/2021-05-26-Sluttrapport-Min-stemme-teller.pdf (downloaded : 20.12.2021).
14. Ådnanes M, Høiseth JR, Magnussen M, Thaulow K, Kaspersen SL. Langt igjen til mål i pakkeforløp for psykisk helse og rus [Internet]. 04.03.2021 [cited 13.12.2021]. Trondheim: Sintef; 2021. Sintef report 2 2021: 00090. Available at: https://www.sintef.no/siste-nytt/2021/langt-til-mal-i-pakkeforlop-for-psykisk-helse-og-rus/
15. Helsebiblioteket.no. PasOpp-undersøkelser – nasjonale brukererfaringer. Oslo: Helsebiblioteket; 2018. Available at: https://www.helsebiblioteket.no/kvalitetsforbedring/brukererfaringer/nasjonale-brukererfaringsundersokelser-pasopp (downloaded 26.01.2021).
16. Folkehelseinstituttet (FHI). Barn og unges erfaringer med psykisk helsevern – poliklinikk BUP. Oslo: FHI; 2018. Available at: https://www.fhi.no/kk/brukererfaringer/sporreskjemabanken/barn-og-unges-erfaringer-med-psykisk-helsevern-poliklinikk-bup/ (downloaded 26.01.2021).
17. Folkehelseinstituttet (FHI). Pasienters erfaringer med norske sykehus i 2019. Metodebeskrivelse og analyser for landet samlet. Rapport 2020:839. Oslo: FHI; 2020. Available at: https://www.fhi.no/contentassets/1ed1cf501b0a43d58415dcbb3ab889e6/metodebeskrivelse-og-analyser-for-landet-samlet.pdf (downloaded 08.02.2021).
18. Sund ER, Opdahl S, Rangul V, Gravaas BC, Eiksund S, Sliper JO, et al. Helse og kronisk sykdom i Trøndelag 2019. Helsestatistikk-rapport 2 fra HUNT4. Levanger: HUNT forskningssenter; 2020. Available at: https://www.ntnu.no/documents/10304/1269212242/Delrapport_Helse_Kronisk+sykdom.pdf/6d581c05-4706-bc84-3330-e96ce4dbfb09?t=1585301810479 (downloaded 20.12.2021).
19. Ådnanes M, Kaspersen SL, Melby L, Lassemo E. Pakkeforløp for psykisk helse og rus – fagfolks erfaringer første året. Trondheim: Sintef; 2020. Sintef report 2020:00064. Available at: https://www.sintef.no/publikasjoner/publikasjon/1799826/ (downloaded 13.12.2021).
20. Folkehelseinstituttet (FHI). Pasienterfaringer med norske sykehus i 2015. Resultater etter en nasjonal undersøkelse. Oslo: FHI; 2016. PasOpp 2016:147. Available at: https://www.fhi.no/contentassets/f1656ccea8d243acabd94ca7574155bf/vedlegg/84-nasjonalt.pdf (downloaded 08.02.2021).
21. Folkehelseinstituttet (FHI). Pasienters erfaringer med døgnopphold i psykisk helsevern. Oslo: FHI; 2020. PasOpp 2020:545. Available at: https://www.fhi.no/contentassets/a95980d9e40649d296e1e5fe08b37920/nasjonale-resultater.pdf (downloaded 08.02.2021).
22. Ranøyen I, Lydersen S, Larose TL, Weidle B, Skokauskas N, Thomsen PH, et al. Developmental course of anxiety and depression from adolescence to young adulthood in a prospective Norwegian clinical cohort. European Child & Adolescent Psychiatry. 2018;27:1413–23. DOI: 10.1007/s00787-018-1139-7
23. Wahl AK, Hanestad BR. Psykososial intervenering og kronisk sykdom. Sykepleien. 2009;90(21):38–41. DOI: 10.4220/sykepleiens.2002.0062
24. Gårdvik KS, Rygg M, Torgersen T, Lydersen S, Indredavik MS. Psychiatric morbidity, somatic comorbidity and substance use in an adolescent psychiatric population at 3-years follow-up. European Child & Adolescent Psychiatry. 2021;30(7):1095–1112. DOI: 10.1007/s00787-020-01602-8
25. Du Rietz E, Jangmo A, Kuja-Halkola R, Chang Z, D’Onofrio BM, Ahnemark E, et al. Trajectories of healthcare utilization and costs of psychiatric and somatic multimorbidity in adults with childhood ADHD: a prospective register-based study. Journal of Child Psychology & Psychiatry. 2020;61(9):959–68. DOI: 10.1111/jcpp.13206
26. Rutter M, Kim-Cohen J, Maughan B. Continuities and discontinuities in psychopathology between childhood and adult life. Journal Child Psychology & Psychiatry. 2006;47(3–4):276–95. DOI: 10.1111/j.1469-7610.2006.01614.x
27. World's Health Organization (WHO). Mental health. Genève: WHO; 2021. Available at: https://www.who.int/health-topics/mental-health#tab=tab_1 (downloaded 08.02.2021).
28. Prop. 121 S (2018–2019). Opptrappingsplan for barn og unges psykiske helse. Oslo: Helse- og omsorgsdepartementet; 2019. Available at: https://www.regjeringen.no/no/dokumenter/prop.-121-s-20182019/id2652917/ (downloaded 02.02.2021).
29. Kivimäki M, Batty GD, Pentti J, Shipley MJ, Sipilä PN, Nyberg S et al. Association between socioeconomic status and the development of mental and physical health conditions in adulthood: a multi-cohort study. The Lancet Public Health. 2020;5(3);e140–9. DOI: 10.1016/S2468-2667(19)30248-8
30. Barstad A. Økonomi, helse og livskvalitet. Oslo: Statistisk sentralbyrå (SSB); 2020. SSB reports 2020/29. Available at: https://www.ssb.no/sosiale-forhold-og-kriminalitet/artikler-og-publikasjoner/okonomi-helse-og-livskvalitet (downloaded 05.10.2021).
31. With ML. Arbeid og utdanning. Oslo: Statistisk sentralbyrå (SSB); 2018. Available at: https://www.ssb.no/sosiale-forhold-og-kriminalitet/artikler-og-publikasjoner/arbeid-og-utdanning (downloaded 09.09.2021).
32. Statistisk sentralbyrå (SSB). Uføretrygdede. Oslo: SSB; 2021. Available at: https://www.ssb.no/sosiale-forhold-og-kriminalitet/trygd-og-stonad/statistikk/uforetrygdede (downloaded 09.09.2021).
33. Helse Midt-Norge, Helse nord, Helse sør-øst, Helse vest. Nasjonal strategigruppe II for psykisk helsevern og TSB. Arbeidsgruppe 3. Ressursbruk og oppgavefordeling innen psykisk helsevern for barn og unge. Pr. 29.06.2011. Available at: https://docplayer.me/13546097-Nasjonal-strategigruppe-ii-for-psykisk-helsevern-og-tsb-arbeidsgruppe-3-ressursbruk-og-oppgavefordeling-innen-psykisk-helsevern-for-barn-og-unge.html (downloaded 12.04.2021).
34. Nasjonalt kompetansesenter for psykisk helsearbeid – NAPHA. FACT-team for unge. Trondheim: NAPHA; 2020. Available at: https://napha.no/content/24269/oppsokende-fact-team-for-unge-i-gang (downloaded 17.09.2021).


Comments